
Switching from Spring Cloud Sleuth to Micrometer Tracing / Micrometer Observation for Spring Boot 3
With the Spring Cloud Release 2022.0 the Spring Cloud Sleuth project will be
removed
from the release train. However, the core of the Sleuth project is being moved
into the Micrometer Tracing project. Because of this, the autoconfiguration from
Sleuth has been moved into Spring Boot 3 with the addition of support for
Micrometer’s new Observation API.
In this article, I will present you an overview of Spring Cloud Sleuth’s API in Spring Boot 2, how to move from Sleuth to Micrometer Tracing and introduce you to the features of the Observation API to better get you started with tracing in Spring Boot 3.
Tracing knowledge / infrastructure / domain
I will assume that you know what a tracer or span is. If not, you can get a quick overview here
To be able to visually represent the tracing data we need some infrastructure for visualization:
- Grafana: visualization of logs, metrics, spans and other tracing data
- Grafana Loki: log aggregation
- Grafana Tempo: distributed tracing backend
- Prometheus: metric scraping
A setup with a docker-compose file for this infrastructure can be found here.
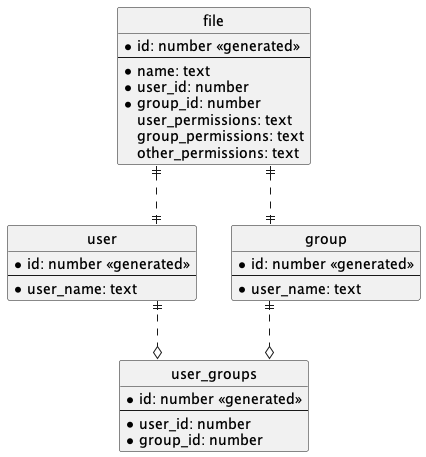
Our domain will be based on the below entity relationship diagram, which represents a very simplified filesystem, where a file has permissions for a user, group and everyone else (other). Note that the concrete implementation is not the focus here. We mostly care about how to work with the different tracing APIs.
All code snippets and screenshots used in this article are based on a demo project, which can be found here
Tracing with Sleuth
To fully utilize our available infrastructure we need the following dependencies in a Spring Boot 2 project.
// Provides metric endpoints
// (However, the prometheus endpoint requires an additional dependency)
implementation 'org.springframework.boot:spring-boot-starter-actuator'

// Spring Cloud BOM (for Spring Boot 2.7.6)
implementation platform('org.springframework.cloud:spring-cloud-dependencies:2021.0.5')

// Cloud starter for Sleuth
implementation 'org.springframework.cloud:spring-cloud-starter-sleuth'
// This dependency is required for Sleuth to send spans to Zipkin
// or a Zipkin compliant tracing distribution system.
implementation 'org.springframework.cloud:spring-cloud-sleuth-zipkin'

// Logback Appender for Grafana Loki
implementation 'com.github.loki4j:loki-logback-appender:1.3.2'

// Without this dependency actuator does not provide a /actuator/prometheus endpoint.
implementation 'io.micrometer:micrometer-registry-prometheus'
And we need to set up Logback with an additional appender that sends application logs to Loki.
<?xml version="1.0" encoding="UTF-8"?>
<configuration>
    <include resource="org/springframework/boot/logging/logback/defaults.xml"/>
    <include resource="org/springframework/boot/logging/logback/console-appender.xml"/>

    <appender name="LOKI" class="com.github.loki4j.logback.Loki4jAppender">
        <http>
            <url>http://localhost:3100/loki/api/v1/push</url>
        </http>
        <format>
            <label>
                <pattern>
                    app=${appName},host=${HOSTNAME},traceID=%X{traceId:-NONE},level=%level
                </pattern>
            </label>
            <message>
                <pattern>${FILE_LOG_PATTERN}</pattern>
            </message>
            <sortByTime>true</sortByTime>
        </format>
    </appender>

    <root level="INFO">
        <appender-ref ref="LOKI"/>
        <appender-ref ref="CONSOLE"/>
    </root>
</configuration>
With this setup we can now create or modify spans for Zipkin compliant tracing distribution systems. Additionally, Sleuth automatically configures instrumentation for other Spring technologies. For example, assuming we are using Spring Web (via spring-boot-starter-web) then Sleuth will automatically create a span whenever a REST endpoint is called from the application.
Using Sleuth’s Tracer interface
The Tracer interface makes it possible for us to create
new spans or to modify existing spans.
For instance, let’s say we want to create a span for when a user is created.
public class TracerUserCreationService {

    // Injected via constructor
    private final UserCreationService userCreationService;
    private final Tracer tracer; // 1

    public UserGroup create(UserCreationRequest creationRequest) {
        var newSpan = this.tracer.nextSpan() // 2
                .name(String.format("create new user %s", creationRequest.userName()));

        try (var ignored = this.tracer.withSpan(newSpan.start())) { // 3
            newSpan.tag("user.name", creationRequest.userName()); // 4
            newSpan.event("start creation of new user and group"); // 5

            return userCreationService.create(creationRequest);
        } finally {
            newSpan.event("end creation of new user and group"); // 5
            newSpan.end(); // 6
        }
    }
}
- An instance of a tracer is injected into the class.
- Create a new span and give it a custom name.
- The span is started using a try-with-resources pattern.
- The span is tagged with the attribute
user.namewith a value fromcreationRequest.userName(). - An event is triggered.
- The span is closed by utilizing the
finallyblock.
If TracerUserCreationService.create() is called, we end up with the following
span inside a trace.
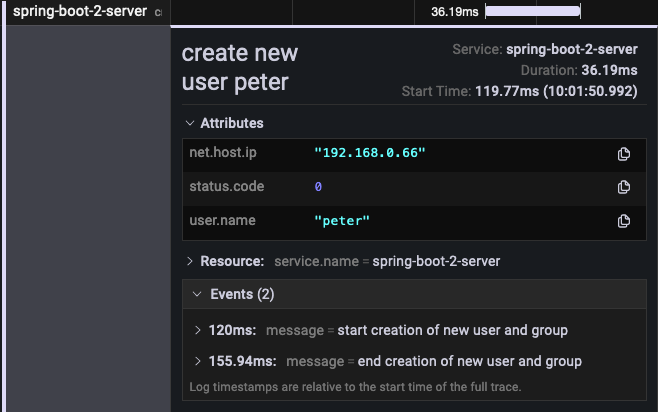
We can see that the attribute user.name has been tagged to the span and that
the events are also visible.
Instead of creating a new span, it is also possible to add information to an existing span.
public UserGroup create(UserCreationRequest creationRequest) {
    var currentSpan = this.tracer.currentSpan();
    if (currentSpan != null) {
        currentSpan.tag("user.name", creationRequest.userName());
        currentSpan.event(String.format(
                "creation for user '%s' was requested", creationRequest.userName()
        ));
    }
    return userCreationService.create(creationRequest);
}
Due to instrumentation, Spring Cloud Sleuth automatically creates a span when a
REST controller method is called. If the above code is called from a
service inside such a controller, this.tracer.currentSpan() returns the
instrumented span which can then be modified by adding tags or events.
However, currentSpan() is not limited to only modifying instrumented spans.
You can use it just fine for self created spans.
The benefit of the tracer approach is that it is very flexible. You can use a tracer to record a span over a unique range of classes and methods. Furthermore, you have access to all variables inside your methods and classes.
However, there is one use case where we can not use a Tracer interface. Let’s
say we want to trace a span or modify an existing span when a Spring Data JPA
interface method is called. We can not use a Tracer interface in that
situation but Sleuth provides a solution for that - annotations.
Using Sleuth’s annotations
Sleuth provides a few annotations to work with spans. These are the following:
NewSpan- Create a new span around an annotated method.SpanTag- Add an annotated method parameter as a tag to a span.ContinueSpan- Marker annotation for methods so manipulation to existing spans can be performed.SpanName- Provide a custom name for some instrumentation cases. For more information see here.
@Repository
public interface UserRepository extends JpaRepository<User, Long> {
    @NewSpan("find user by name")
    Optional<User> findByName(@SpanTag("user.name") String userName);
}
The main benefit of these annotations is the usage on interface methods
where we can not work with a tracer. However, it is also possible to use the
annotation on normal classes if using the tracer interface creates too much
boilerplate for you. Bear in mind that the annotations lack flexibility because
they are designed for interfaces. For instance, when creating a user we
could put the user.name into the span name and add any variable present in
the method as a tag to the span or into an event name. With the NewSpan
annotation we can only provide static span names and at most use parameters
for tags. Therefore, if the annotations are too restrictive for you, you will
have to create some form of helper class or method to reduce the boilerplate.
In the case that you do not want to create a new span, but only provide more
context for an existing span, you need to use the ContinueSpan annotation.
@ContinueSpan(log = "user.create")
public UserGroup create(
        @SpanTag("user.creation.request") UserCreationRequest creationRequest
) {
    return userCreationService.create(creationRequest);
}
The log attribute in the ContinueSpan annotation causes Sleuth to create
an event when the span starts and ends.
Overall, Sleuth offers two ways to manually create spans either with a Tracer
abstraction or annotations. Let’s see what we get with the new Observation API.
Tracing with Micrometer Observation
To get started with observations we need to migrate our project to Spring Boot 3, add some Micrometer dependencies and remove the dependency on Spring Cloud Sleuth.
// Provides metric endpoints and generall mertics/tracing autoconfiguration
// (However, the prometheus endpoint requires an additional dependency)
implementation 'org.springframework.boot:spring-boot-starter-actuator'
// AOP is needed for the `Observed` annotation
implementation 'org.springframework.boot:spring-boot-starter-aop' // 1

// Tracing dependencies after Spring Boot 3
implementation 'io.micrometer:micrometer-tracing-bridge-brave' // 2
implementation 'io.zipkin.reporter2:zipkin-reporter-brave'

// Without this dependency actuator does not provide a /actuator/prometheus endpoint.
implementation 'io.micrometer:micrometer-registry-prometheus'

// Logback Appender for Grafana Loki
implementation "com.github.loki4j:loki-logback-appender:$loki4jVersion" // 3

// Documentation generation for ObservationDocumentation classes
adoc "io.micrometer:micrometer-docs-generator:$micrometerDocsVersion" // 4

// Dependency for testing observations
testImplementation 'io.micrometer:micrometer-observation-test' // 5
- The Observation API offers an
Observedannotation. For this annotation to work the AOP starter and some manual configuration is required. - Depending on your tracing infrastructure you need to select the appropriate
bridge and span reporter for the Micrometer tracer. The available
implementations are listed
here.
The bridge dependency automatically pulls in the
micrometer-tracingandmicrometer-observationdependency. - The Logback Appender for Loki is the same as in Spring Boot 2.
- It is possible to generate documentation for the spans and metrics created by observations. This feature is optional and requires some additional setup in your build tool of choice. We will take a look at it later in this article.
- Finally, to be able to test our observations Micrometer offers a dependency for that as well. You do write tests for your code after all, right?
What remains from Sleuth?
Most of the Sleuth code was moved around into other projects. In general, the core of Sleuth is now in Micrometer Tracing while some parts like instrumentation are in different projects.
A high level overview for a Spring Cloud Sleuth migration to Micrometer is provided here. Overall, you can expect the following changes to be required on your side.
Instrumentation
Depending on what instrumentations you rely on you might have to manually add them. For example, JDBC instrumentations now require the Datasource Micrometer project.
Sleuth package references
All Sleuth related package references need to be changed to Micrometer ones.
import org.springframework.cloud.sleuth.Tracer;
// to
import io.micrometer.tracing.Tracer;
So you can still use the Tracer interface by simply changing the package name reference.
Trace and span id in log messages
By default, log messages will not include the trace and span id. It needs to be manually added to the logger pattern.
# Take the span id and trace id from the Mapped Diagnostic Context (MDC) and
# put them into the log message.
logging.pattern.level=%5p [${spring.application.name:},%X{traceId:-},%X{spanId:-}]
W3C headers by default
Trace ids are now generated as W3C ids and not B3 ids - Spring Cloud Sleuth 3.1 Migration
The default Tracer now is OpenTelemetry tracer, the default Trace Id format is 128 bit and default Context Propagation format is W3C.
Therefore, if you need B3 headers, you need to set the following property to publish B3 and W3C headers.
spring.sleuth.propagation.type=w3c,b3
Unclear support for Sleuth’s annotations
This is not explicitly mentioned in the Spring Boot documentation, but it seems there is no support for Sleuth’s annotations in Spring Boot 3.
While the Sleuth annotations were moved into the Micrometer Tracing project,
there is no aspect oriented programming (AOP) implementation available in
Spring Boot 3 that processes them. Meaning, if you want to continue to use
these annotations, you need to provide a manual AOP implementation for them
and expose it as a bean. Otherwise, you need to switch to the Observation
API and use the Observed annotation.
Using the Observation API
There are two ways to use the Observation API. Either with the interface
Observation or the Observed annotation.
First, let’s start with the interface. The interface provides a scoped
and unscoped approach. In the unscoped approach either a Runnable or
Supplier functional interface is passed to Observation.observe().
@Service
public class ObservationFileCreationService {

    // Injected via constructor
    private final FileCreationService fileCreationService;
    private final ObservationRegistry observationRegistry;

    public File create(FileCreationRequest creationRequest) {
        return Observation.createNotStarted("file.create", observationRegistry) // 1
                .contextualName("create file for user (Observation API)") // 2
                .lowCardinalityKeyValue("file.user.name", creationRequest.userName()) // 3
                .lowCardinalityKeyValue("file.group.name", creationRequest.groupName())
                .highCardinalityKeyValue("file.name", creationRequest.fileName()) // 4
                .observe(() -> fileCreationService.create(creationRequest));// 5
    }
}
There are a few things to explain in this snippet:
-
As the method name implies, this creates a not started observation. There are a few overloads available for this method. We are not going to go all over them in this article but if you want to read up about them, click here. This method takes an
ObservationRegistryinterface as an argument because there are some global configurations that can be applied to a registry. These configurations might affect how the observation is processed. -
The contextual name is used as the span name. If no contextual name is given, then the observation name (
file.create) will be used as a basis for the span name. -
Low cardinality describes key values that are bounded - The value of the key changes infrequently or rarely. Low cardinality keys will be tagged to the span and metrics created by the observation.
-
High cardinality describes key values that are unbounded - The value of the key changes frequently or regularly. High cardinality keys will only be tagged to spans created by the observation.
-
This call will start the observation which will do the following:
- Start a span before the functional interface begins and close the span after the functional interface is finished.
- Create a timer and long task timer based on the observation name
file.create.
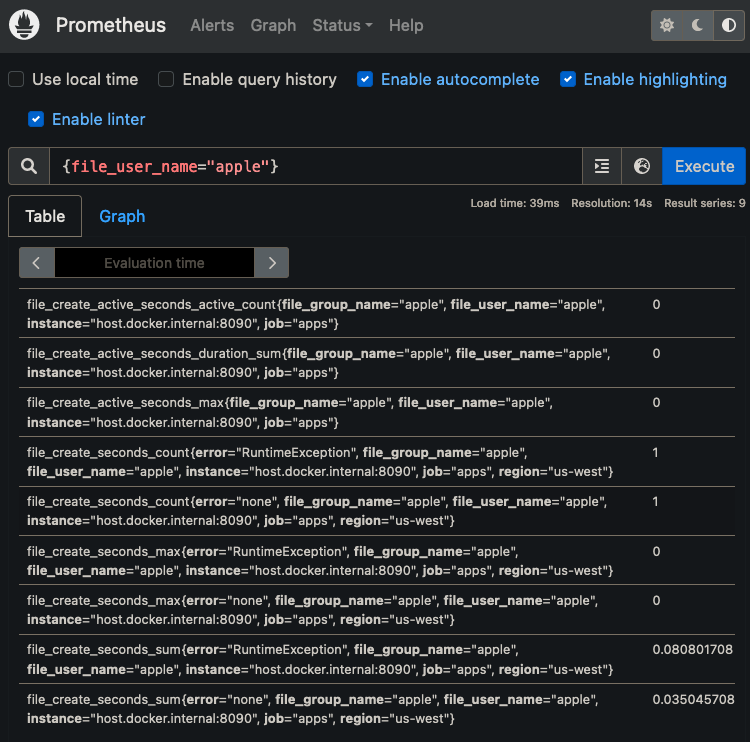
In Prometheus, we can see the created timer and long task timer.

And here the same metrics but by searching with the low cardinality key
file.user.name.
One thing to note: It is not possible to create events for an observation
in the unscoped approach. Events can only be added for observations that are
already started. With observe() the observation starts and ends around
either the provided Supplier or Runnable functional interface.
So by doing the following:
return Observation.createNotStarted("file.create", observationRegistry)
        .event(Observation.Event.of("Test event"))
        .observe(() -> fileCreationService.create(creationRequest));
You would attempt to create an event for an observation that is created but not running.
The scoped approach to creating observations resolves this issue by taking
care of scoping manually with Observation.openScope().
public File create(FileCreationRequest creationRequest) {
    var observation = Observation.start("file.create", observationRegistry);
    try (var ignored = observation.openScope()) {
        observation.contextualName("create new file for user (Observation Scope)");
        observation.lowCardinalityKeyValue(
                "file.user.name", creationRequest.userName());
        observation.lowCardinalityKeyValue(
                "file.group.name", creationRequest.groupName());
        observation.highCardinalityKeyValue(
                "file.name", creationRequest.fileName());

        observation.event(Observation.Event.of("start file creation"));
        return fileCreationService.create(creationRequest);
    } finally {
        observation.event(Observation.Event.of("end file creation"));
        observation.stop();
    }
}
Fundamentally, using scopes is mostly the same as when using observe(). You
have access to the same methods and can chain them together if desired. The
major differences are that you get control of when the observation ends, and
you can create events.
Next up is the Observed annotation. Before using the annotation it is
necessary to register a bean of an ObservedAspect class. If this is not done,
the annotation will not be processed and no observation will be created.
@Configuration(proxyBeanMethods = false)
public class ObservedAspectConfig {
    @Bean
    public ObservedAspect observedAspect(ObservationRegistry observationRegistry) {
        return new ObservedAspect(observationRegistry);
    }
}
Once this is done, the annotation can be used like this.
@Observed(
    name = "file.creation",
    contextualName = "observed annotation showcase",
    lowCardinalityKeyValues = {"class.name", "ObservedFileCreationService"}
)
public File create(final FileCreationRequest creationRequest) {
    return fileCreationService.create(creationRequest);
}
In essence, the Observed annotation is similar to the NewSpan annotation.
However, compared to the Sleuth annotation it is possible to manipulate
observations created by the Observed annotation. This can be done with
features of the Observation API I will demonstrate later in this article.
With this we have mostly covered how you use the Observation API to start your observations. But don’t worry, the Observation API is not just a fancy way to create a span, timer and long task timer. There are many things still left to explore.
Observation contexts and conventions
Every observation uses a Observation.Context class. The context is just a
data store to share data to observation conventions. A convention is either
an implementation of the ObservationConvention<T> interface or the
GlobalObservationConvention<T> interface. Conventions can create low/high
cardinality keys, set the contextual name if given and set the observation
name used for metrics.
We can create our own context for a specific use case that we want to observe which then later gets handled by a convention.
For example, when a user creates a file we would like to know the following information:
- What is the name of the file?
- To which user does the file belong?
- To which group does the file belong?
- What are the user permissions of the file?
- What are the group permissions of the file?
- What are the other permissions of the file?
A context that answers these questions might look like this.
public class FileCreationObservationContext extends Observation.Context {
    private final String fileName;
    private final String userName;
    private final String groupName;
    private final String userPermissions;
    private final String groupPermissions;
    private final String otherPermissions;

    // Constructor, getters and setters ...
}
We can now provide this context to the Observation.createNotStarted()
and Observation.start() calls using a Supplier functional interface.
@Service
public class ObservationFileCreationService {

    // Injected in constructor
    private final FileCreationService fileCreationService;
    private final ObservationRegistry observationRegistry;

    public File create(FileCreationRequest creationRequest) {
        return Observation.createNotStarted(
                "file.creation",
                () -> FileCreationObservationContext.from(creationRequest),
                observationRegistry
        ).observe(() -> fileCreationService.create(creationRequest));
    }
}
However, right now this will not change anything in regard to the span or metric
tags because our injected observationRegistry variable does not know what
to do with the data present in our context. To teach it how to handle it, we
need to implement the GlobalObservationConvention interface for the type
FileCreationObservationContext on a class.
public class GlobalFileCreationObservationConvention
    implements GlobalObservationConvention<FileCreationObservationContext> {// 1

    @Override
    public boolean supportsContext(Observation.Context context) { // 2
        return context instanceof FileCreationObservationContext;
    }

    @Override
    public KeyValues getLowCardinalityKeyValues(FileCreationObservationContext context) { // 3
        return KeyValues.of(
                KeyValue.of("user.name", context.getUserName()),
                KeyValue.of("group.name", context.getGroupName())
        );
    }

    @Override
    public KeyValues getHighCardinalityKeyValues(FileCreationObservationContext context) { // 4
        return KeyValues.of(
                KeyValue.of("file.name", context.getUserName()),
                KeyValue.of("file.permission.user", context.getGroupName()),
                KeyValue.of("file.permission.group", context.getGroupName()),
                KeyValue.of("file.permission.other", context.getGroupName())
        );
    }

    @Override
    public String getName() { // 5
        return "file.creation";
    }

    @Override
    public String getContextualName(FileCreationObservationContext ignored) { // 6
        return "create file for user and group";
    }
}
-
All interface methods, excluding
supportsContext(), offer a default implementation. You can choose which methods to override based on your requirements. -
Checks if the convention supports the context. If not, the convention will not be applied.
-
The low cardinality keys to add to the span and metrics as tags.
-
The high cardinality keys to add to the span as tags.
-
The name of the observation.
-
The name to use for the span if the method is implemented. Otherwise, the name of the observation will be used.
Now the convention needs to be added to the registry.
@Configuration(proxyBeanMethods = false)
public class ObservationRegistryConfig
    implements ObservationRegistryCustomizer<ObservationRegistry> {

    @Override
    public void customize(ObservationRegistry registry) {
        registry.observationConfig()
                .observationConvention(new GlobalFileCreationObservationConvention());
    }
}
By implementing the ObservationRegistryCustomizer interface on a
configuration class, we can apply customizations on Spring Boot’s
autoconfigured ObservationRegistry implementation. Note the generic type on
the interface. This means we could use the interface to configure all registries
of a specific subtype instead of all registries implementing the
ObservationRegistry interface.
If you do not want to add a global convention to the registry, you can
implement the ObservationConvention interface and pass it directly to
Observation.start() or Observation.createNotStarted(), rather than using
the GlobalObservationConvention interface.
public File create(final FileCreationRequest creationRequest) {
    return Observation.createNotStarted(
                    new CustomFileCreationObservationConvention(),
                    () -> FileCreationObservationContext.from(creationRequest),
                    observationRegistry
            ).contextualName("observation with overridden convention")
            .observe(() -> fileCreationService.create(creationRequest));
}
The implementation effort for a global and non-global convention are equal since
the GlobalObservationConvention is just a marker interface.
public interface GlobalObservationConvention<T extends Observation.Context>
        extends ObservationConvention<T> {
}
As we can see, contexts help us group relevant data together and with conventions we can define how our contexts should be handled during an observation. But is there a way we can add low/high cardinality keys and general attributes to all contexts?
Observation filters
In the case that there is some data we want present in all observation contexts
we can use an implementation of the ObservationFilter interface. For
example, let’s assume that our services run in multiple regions in the
United States and every service has their region set in the application
properties. We want to expose this information in the tags of all created
spans, either instrumented by a library or manually created.
public class RegionObservationFilter implements ObservationFilter {

    private final String region;

    public RegionObservationFilter(String region) {
        this.region = region;
    }

    @Override
    public Observation.Context map(Observation.Context context) {
        return context
                .put("region", region)
                .addLowCardinalityKeyValue(KeyValue.of("region", region));
    }
}
The setup of the filter is very straight forward. As you can see in the snippet, you can also put data into the context which makes it available in observation relevant classes/interfaces that have access to the context.
Now we just need to register the filter on the ObservationRegistry
implementation which is done in a similar way to how a convention is added.
public class ObservationRegistryConfig
    implements ObservationRegistryCustomizer<ObservationRegistry> {

    @Value("${region}")
    private String region;

    @Override
    public void customize(ObservationRegistry registry) {
        registry.observationConfig()
                .observationFilter(new RegionObservationFilter(region));
    }
}
The value for the region attribute is derived from our application properties
which contains the following value for region.
region=us-west
With the filter now present on the registry all spans and metrics, even instrumented ones, will contain the region attribute.

As you can see, contrary to the name, a filter can be used to manipulate the
observation context to include new data or remove data. If your goal
is to limit observations to specific circumstances, then you are looking for
the ObservationPredicate interface.
Observation predicates
Sometimes it might be useful to not create an observation under specific
conditions. Maybe the observed method has a frequently occurring case or there
is a situation we never want to observe. For such a case an
ObservationPredicate implementation can be used.
public class FileCreationObservationPredicate implements ObservationPredicate {

    @Override
    public boolean test(String ignoredObservationName, Observation.Context context) {
        if (context instanceof FileCreationObservationContext context) {
            return !"logger".equalsIgnoreCase(context.getUserName());
        }
        return true;
    }

}
Here the use case is that we want to ignore all observations occurring for
the “logger” user. Returning true from this method indicates that the
observation should be processed while returning false ignores it.
Lastly, the predicate must be registered on the registry.
registry.observationConfig()
        .observationPredicate(new FileCreationObservationPredicate());
So far, we have looked at different ways to interact with the data gathered during an observation or how to control when an observation should be performed. One more thing we can do is to react to the lifecycle of an observation.
Observation handlers
Observation handlers allow us to hook into the lifecycles of observations.
By implementing the ObservationHandler interface on a class and overriding
the interface’s default implementations, it is possible to perform custom
actions on specific lifecycle events.
public class FileCreationObservationHandler
    implements ObservationHandler<FileCreationObservationContext> {

    @Override
    public boolean supportsContext(Observation.Context context) {
        return context instanceof FileCreationObservationContext;
    }

    @Override
    public void onStart(FileCreationObservationContext context) {
        log.info("File creation observation started for context: {}", context);
    }

    @Override
    public void onError(FileCreationObservationContext context) {
        log.error("Error occurred while observing context: {}", context);
    }

    @Override
    public void onStop(FileCreationObservationContext context) {
        log.info("File creation observation stopped for context: {}", context);
    }
}
In this example, the handler reacts to the lifecycle events start, stop and
error for all observations that use a FileCreationObservationContext class.
When these events occur the handler writes out a log statement containing the
context. However, logging is not the only use case for a handler. You could
create metrics inside a handler as well.
With the help of handlers we can improve our understanding of what happens during the runtime of an observation. What also helps us understand our application better are tests.
Observation testing
As mentioned in the beginning on how to get started with observations, it is possible to test them. This allows us to verify if the setup of an observation records the right data. To be able to test observations an additional dependency is required.
// The version can be derived either from Spring's BOM or Micrometer's BOM.
testImplementation 'io.micrometer:micrometer-observation-test'
This will give us access to the TestObservationRegistryAssert class. With it,
we get unique assertions for observations.
Here is an example showing if the GlobalFileObservationConvention class is
setting context attributes properly.
@ExtendWith(MockitoExtension.class)
class FileCreationServiceObservationTest {

    @Mock
    private UserService userService;

    @Mock
    private GroupService groupService;

    @Mock
    private FileService fileService;

    private TestObservationRegistry registry;
    private FileCreationService fileCreationService;

    @BeforeEach
    void setup() {
        registry = TestObservationRegistry.create();
        fileCreationService = new FileCreationService(
                userService, groupService, fileService, registry
        );
    }

    @Test
    void test_observation_should_properly_create_context() {
        registry.observationConfig()
                .observationConvention(new GlobalFileCreationObservationConvention());

        var user = User.builder()
                .name("john")
                .build();
        var group = Group.builder()
                .name("john")
                .build();
        when(userService.getUser(anyString())).thenReturn(Optional.of(user));
        when(groupService.getGroup(anyString())).thenReturn(Optional.of(group));

        var request = FileCreationRequest.builder()
                // Fixture data ...
                .build();
        fileCreationService.create(request);

        TestObservationRegistryAssert.assertThat(registry)
                .doesNotHaveAnyRemainingCurrentObservation()
                .hasObservationWithNameEqualTo("file.creation")
                .that()
                .hasLowCardinalityKeyValue("file.user.name", request.userName())
                .hasLowCardinalityKeyValue("file.group.name", request.groupName())
                .hasHighCardinalityKeyValue("file.name", request.fileName())
                .hasHighCardinalityKeyValue(
                        "file.permission.user", request.userPermissions())
                .hasHighCardinalityKeyValue(
                        "file.permission.group", request.groupPermissions())
                .hasHighCardinalityKeyValue(
                        "file.permission.other", request.otherPermissions())
                .hasBeenStarted()
                .hasBeenStopped();
    }
}
By testing observations, we can make sure that they behave as intended and assert that the context contains the right data. Additionally, it serves as some form of the documentation for the observations since you can verify the contextual name, low/high cardinality keys, filters, conventions and so on.
Furthermore, if documenting your spans and metrics is important to you, there is a way to generate such documentation for your observations.
Observation documentation
The Micrometer project offers an optional
dependency - io.micrometer:micrometer-docs-generator - which makes it
possible to generate documentation for documented observations. However,
there is some setup required on the code and build script side to make the
generation possible.
Code setup
The dependency will generate documentation from all code that implements
the ObservationDocumentation interface under the following conditions
documented
here.
- Observations are grouped within an enum - the enum implements the
ObservationDocumentationinterface- If the observation contains
KeyNamethen those need to be declared as nested enums- The
ObservationDocumentation#getHighCardinalityKeyNames()need to call the nested enum’svalues()method to retrieve the array of allowed keys- The
ObservationDocumentation#getLowCardinalityKeyNames()need to call the nested enum’svalues()method to retrieve the array of allowed keys- Javadocs around enums will be used as description
- If you want to merge different
KeyNameenumvalues()methods you need to call theKeyName#merge(KeyName[]...)method
With this in mind we can create the following implementation of
a ObservationDocumentation.
public enum FileCreationObservationDocumentation
    implements ObservationDocumentation { // 1
    /**
     * Observe the creation of a new file for a specific user.
     */
    FILE_CREATION { // 2

        @Override
        public Class<? extends ObservationConvention<? extends Observation.Context>>
        getDefaultConvention() {
            return GlobalFileCreationObservationConvention.class; // 3
        }

        @Override
        public KeyName[] getLowCardinalityKeyNames() {
            return FileCreationLowCardinalityKeys.values(); // 4
        }

        @Override
        public KeyName[] getHighCardinalityKeyNames() {
            return FileCreationHighCardinalityKeys.values(); // 4
        }

        @Override
        public String getPrefix() {
            return "file"; // 5
        }
    };

    public enum FileCreationLowCardinalityKeys implements KeyName { // 6
        /**
         * Name of the user for which a file was created.
         */
        USER_NAME {
            @Override
            public String asString() {
                return "file.user.name";
            }
        },
        // Other keys ...
    }

    public enum FileCreationHighCardinalityKeys implements KeyName { // 6
        /**
         * Name of the created file.
         */
        FILE_NAME {
            @Override
            public String asString() {
                return "file.name";
            }
        },
        // Other keys ...
    }
}
-
This is the parent enum that defines our documented observations as first level values and cardinality keys as nested child enums. The
ObservationDocumentationinterface provides default methods that need to be overwritten based on your requirements. -
Every documented observation needs to be commented with Javadoc. If no Javadoc is present, the generation is not possible, and you will get the following error:
Observation / Meter javadoc description must not be empty -
A documented observation has a default convention. The convention can be overwritten when accessing the enum value.
-
getLowCardinalityKeyNames()andgetHighCardinalityKeyNames()tells the observation what keys are allowed in a context. -
All cardinality keys must be prefixed with the given
String. -
The cardinality keys are defined as nested child enums. These contain the names of the keys. The Javadoc is optional, but it will be used in the created documents, so it is helpful to add it.
An immediate benefit of the above implementation is that we have a single place for our cardinality key names which we can use to our advantage in conventions.
import static ...FileCreationObservationDocumentation.FileCreationHighCardinalityKeys;
import static ...FileCreationObservationDocumentation.FileCreationLowCardinalityKeys;

public class GlobalFileCreationObservationConvention
        implements GlobalObservationConvention<FileCreationObservationContext> {

    // Other methods omitted for brevity.

   @Override
   public KeyValues getLowCardinalityKeyValues(FileCreationObservationContext context) {
      return KeyValues.of(
              FileCreationLowCardinalityKeys.USER_NAME.withValue(context.getGroupName()),
              // Other keys
      );
   }

   @Override
   public KeyValues getHighCardinalityKeyValues(FileCreationObservationContext context) {
      return KeyValues.of(
              FileCreationHighCardinalityKeys.FILE_NAME.withValue(context.getFileName()),
              // Other keys
      );
   }
}
Now all that’s left is to use the documented observation in code like this.
public class ObservationDocumentFileCreationService {
   // Dependencies and constructor ...

   public File create(final FileCreationRequest creationRequest) {
      return FileCreationObservationDocumentation.FILE_CREATION
              .observation(
                      observationRegistry,
                      () -> FileCreationObservationContext.from(creationRequest)
              )
              .observe(() -> fileCreationService.create(creationRequest));
   }
}
The parent level enum values of the FileCreationObservationDocumentation enum
are used to access the specific observation to start. In this case, there is
only one choice. The observation() call is required to provide
customizations to the observation and to receive an observation instance.
This instance can than be started with start() or observe().
This concludes the code requirements. We now move on to the build script side.
Build script
Since I use Gradle, I will showcase the setup for Gradle here. If you use Maven, then look here.
To generate our documents we first create a custom configuration and add the Micrometer dependency under that configuration.
configurations {
    adoc
}

dependencies {
    adoc "io.micrometer:micrometer-docs-generator:$micrometerDocsVersion"
}
Then a custom task is created that performs the generation.
task generateObservabilityDocs(type: JavaExec, group: 'documentation') {
    mainClass = "io.micrometer.docs.DocsGeneratorCommand"
    classpath configurations.adoc
    // input folder
    args project.rootDir.getAbsolutePath(),
            // inclusion pattern
            ".*",
            // output folder
            project.rootProject.buildDir.getAbsolutePath()
}
This task will do the following: In the classpath of configurations.adoc run
the main method of the DocsGeneratorCommand class which will create three
documents:
_conventions.adoc_metrics.adoc_spans.adoc
You can take a look at the generated documents here
Conclusion
The Observation API is a new approach to provide an implementation agnostic tracing solution outside the Spring ecosystem. In comparison to Spring Cloud Sleuth it offers many new features that emphasize a focus on making it easy to observe the right and relevant data.
The tracer and annotation APIs of Sleuth are still available, however, it
seems that only the tracer got properly carried over in Spring Boot 3 while the
annotations are to be replaced by the Observed annotation.
Overall, the Observation API is a nice addition to the list of tools you can
use for tracing. However, there might still be cases where only a Tracer suits
your needs better.
Resources
- Spring Boot - Production Ready features - 5. Observability
- Spring Boot - Production Ready features - 7. Metrics
- Spring Boot - Production Ready features - 8. Tracing
- Micrometer Tracing
- Micrometer Observation
- Spring Blog - Observability with Spring Boot 3
- Spring Cloud Sleuth 3.1 Migration Guide
- Spring Cloud - Release Notes