Technical deep dive into Grafana Faro
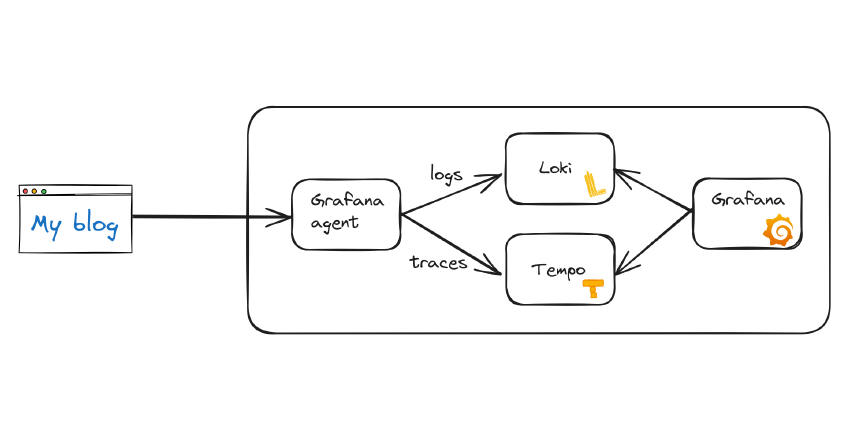
As shown in my previous post you can add Grafana Faro to get more information about users who visit a website, in my case my own blog. This is how that setup looks like:
But what kind of data is available now?
Data sent by the browser
The libraries from the Web SDK collect technical details about the browser interaction. The goal is not to track users, but to collect all sorts of technical data to see if there are problems with the web pages and what the perceived performance is for the users. For a website with only static pages, performance is mainly determined by the speed at which the web server delivers the files. But for more dynamic pages, it is very helpful to have more insight.
WebVitals and Events
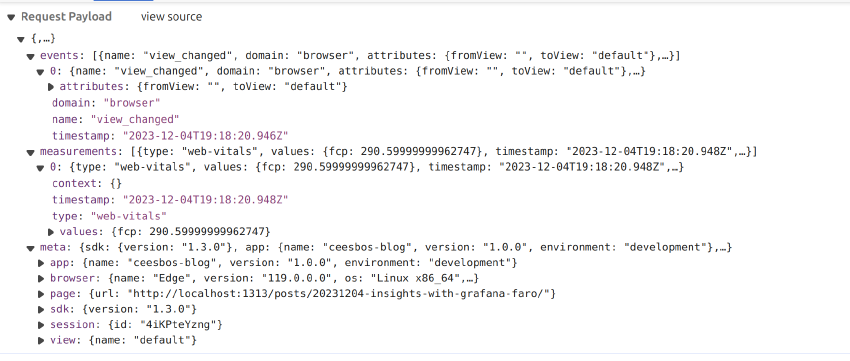
Data is sent in batches to the Faro endpoint. The data has a JSON structure.
There is a meta section which contains metadata about all the data sent. This includes information about the browser used, but also the application version and library version used to generate the data.
This information is useful for more detailed analysis in case of problems.
Data sent by the browser
In the screenshot above you can already see two types of data: events and measurements.
In this case we are sending fcp measurement data. FCP stands for ‘First Contentful Paint’. This type of information can be very useful for the frontend team to improve the customer experience of a web page.
The Faro collector sends this data to the log storage, in my case Grafana Loki.
Javascript errors and console log messages
Javascript errors and console log messages are also captured. See an example below.

Browser console log message

Send a log message to the Faro collector endpoint
Console messages can contain useful information about the state of your web application. But also javascript errors are captured including the stacktrace. Based on this, you can see what kind of problems customers are having, and from the metadata you can find out if these are maybe related to a new release.
Traces
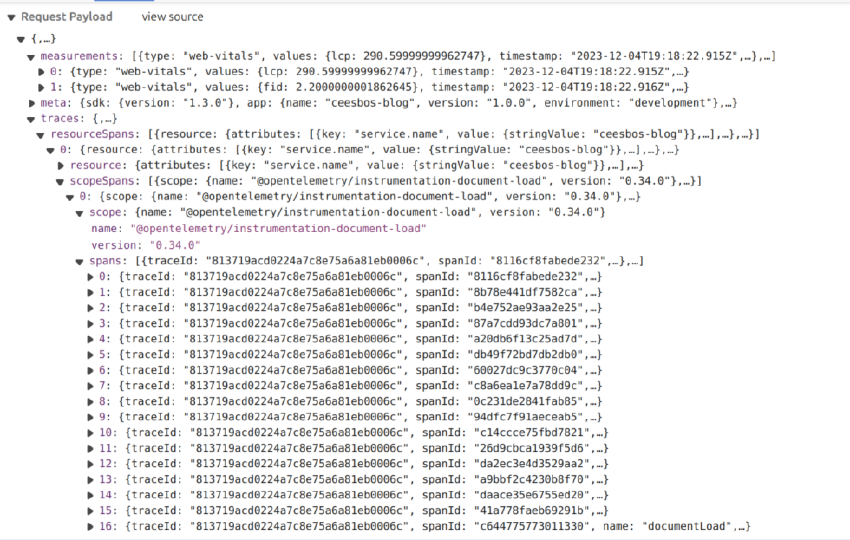
Trace data is sent to the Faro Collector endpoint in the same way as all other data. Here is the data in JSON format. The collector sends it to the configured trace store, in my case Grafana Tempo.
Send trace data
Data available in Grafana Loki
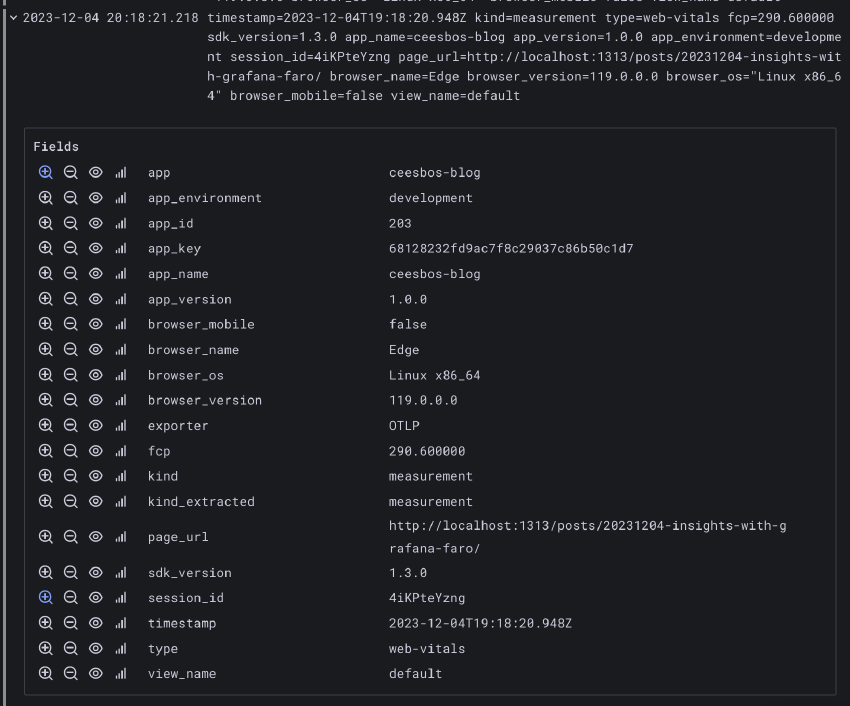
All data from measurements, javascript errors, console messages and events are sent to Loki. To query Loki you can use LogQL. I have used LogQL in a number of other situations and it has been very helpful in finding problems. I plan to write more about this in another post. This is just a query to get all the rows for a single session:
{app="ceesbos-blog"} | logfmt | session_id="4iKPteYzng"
Same FCP line, but now in Loki
The FCP measurement above is also available. Based on all this data it is also possible to create dashboards. Examples of what this can look like can be found here
Data available in Grafana Tempo
In the network tab of the browser’s developer tools, you can see a waterfall view at the top showing the sequence requests. This view is quite small, but it gives you an idea of the time taken by the requests.
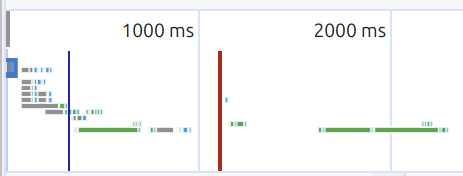
Trace view in Grafana
The same view is available in Grafana Tempo, not only for your own session, but for all the sessions of the visitors to your pages.
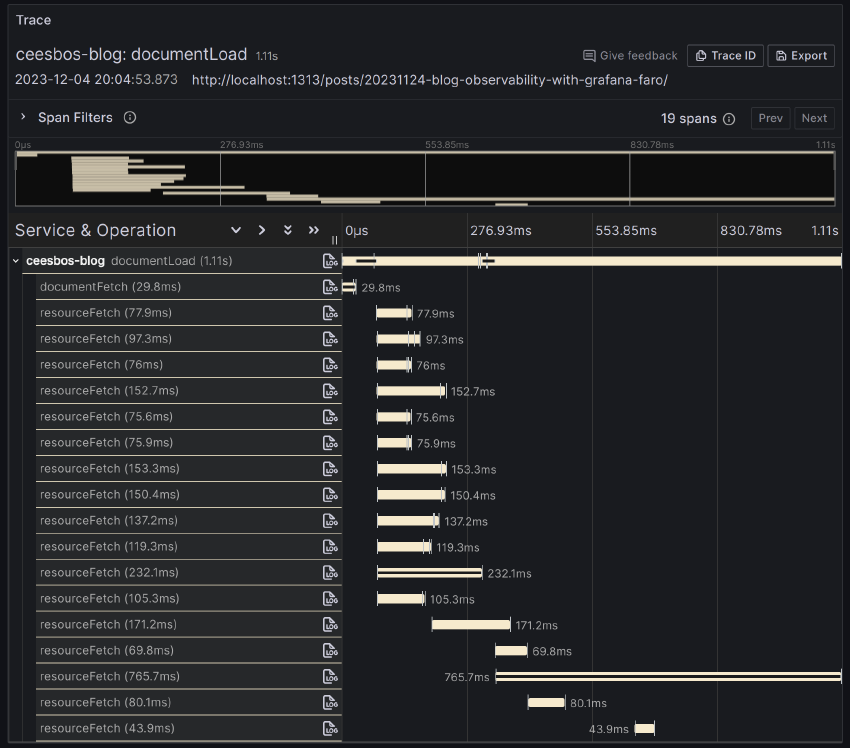
Trace view in Grafana
Custom dashboard of page visits
The whole journey started with getting more insight into the page views of my blog. And this is what it looks like:
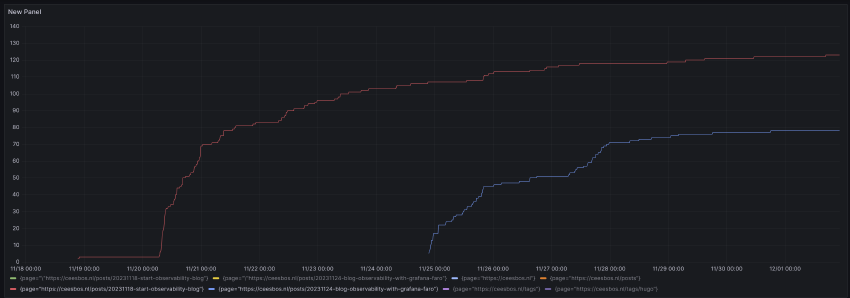
Number of page views of my first two blog posts in the first 2 weeks of my blog
I created the first blog before the weekend, but did not announce it publicly. After the weekend I wrote a message about it on LinkedIn and after that people were able to find the page. This is clearly visible. The second blog post I wrote a week later and published on LinkedIn a bit later. You can see that too.
Grafana Faro is useful to gain some insight into blog post visits, but it is much more useful to see how web applications behave from a technical point of view. Observability is not limited to backend applications, but can also be used to gain insight into frontend applications.
Originally published on Cees’ blog at https://ceesbos.nl/posts/20231204-technical-deep-dive-into-grafana-faro/.

